Compensation Survey Data 2026: What Mercer’s Numbers Actually Show, Who Uses Them, and Why the Benchmarks You See Are Already Stale
Quick Answer
- Compensation survey data is employer-reported pay information used to benchmark salaries, not a settlement or claims program.
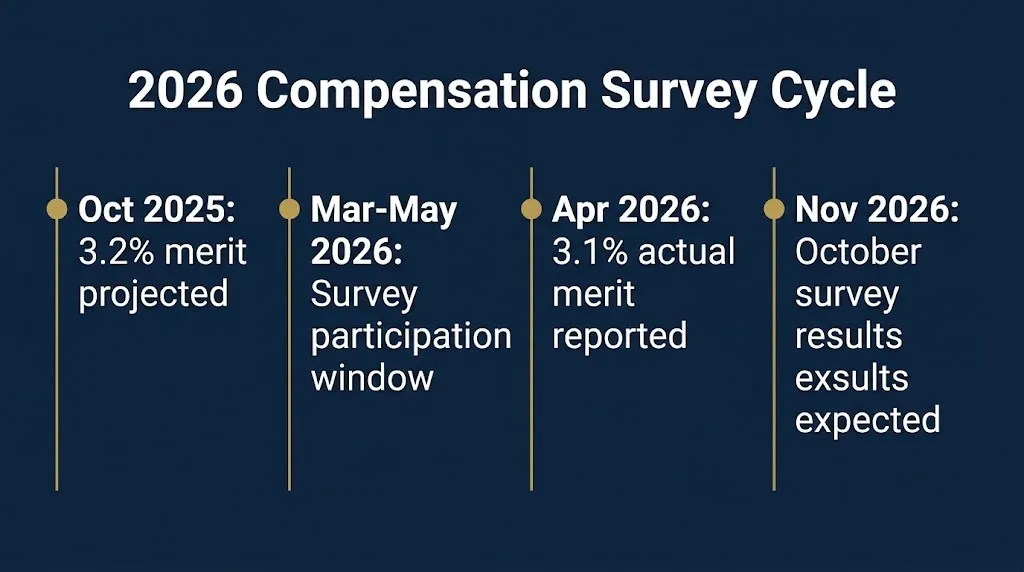
- Mercer’s 2026 survey shows actual merit increases of 3.1%, down from 3.3% in 2024 and 3.2% projected for 2026.
- The biggest deadline is participation: Mercer’s main US survey window ran from March 2 to May 4, 2026.
You searched for compensation survey data because you are setting pay, negotiating an offer, or trying to figure out whether your salary is competitive. The data is real, and it is useful, but it is not a live feed of the market.
Mercer’s 2026 QuickPulse survey collected responses from 756 employers and found that actual merit increases came in at 3.1%, just below the 3.2% projected in October 2025 . Total increases, which include merit, promotions, and other adjustments, landed at 3.4% against a 3.5% projection .
The number that matters most is not the increase percentage. It is the lag. Compensation survey data typically describes a market from 6 to 12 months ago by the time it reaches your desk . You are benchmarking against a photograph, not a live video.
This article breaks down what Mercer’s 2026 data actually says, how the survey process works, why the benchmarks you pull are older than they look, and how to use survey data without treating it as gospel.
The Facts
| Item | Detail |
|---|---|
| Survey | Mercer QuickPulse US Compensation Planning Survey, March 2026 Edition |
| Participants | 756 employers |
| Actual Merit Increase | 3.1% |
| Actual Total Increase | 3.4% |
| October 2025 Projection | 3.2% merit, 3.5% total |
| Participation Window | March 2 to May 4, 2026 for main Mercer surveys |
| Data Lag | Typically 6 to 12 months by publication |
Is Compensation Survey Data Real or a Scam?
Compensation survey data is real, and Mercer is one of the largest and most established providers. The data comes from employer submissions, is aggregated, and is sold or shared with participating organizations. There is no scam in the core product.
The confusion comes from the word “survey.” This is not a consumer opinion poll or a settlement fund. It is a business-to-business data product. Employers pay for access or receive results in exchange for participating. The numbers describe what companies pay, not what you are owed.
Scam risk exists at the edges. Pages that promise “unclaimed compensation survey payouts” or ask you to pay to access a “salary settlement” are not connected to Mercer or any legitimate survey provider. If a site asks for your Social Security number to check salary data, close it.
Key Takeaway: Compensation survey data is a legitimate employer benchmarking tool, not a consumer compensation program, and no payout or claim exists.
How Much Did Mercer’s 2026 Survey Show for Pay Increases?
Mercer’s 2026 data shows actual merit increases of 3.1% and total increases of 3.4%, both slightly below October 2025 projections . The gap is small, just one-tenth of a percentage point on each measure, but it confirms a pattern: employers projected slightly more than they delivered.
The 3.1% merit figure is down from 3.3% in 2024 and 3.2% in 2025 . Total increases followed the same downward drift, from 3.6% in 2024 to 3.4% in 2026 . Budgets are not collapsing. They are tightening.
| Year | Merit Increase | Total Increase |
|---|---|---|
| 2024 | 3.3% | 3.6% |
| 2025 | 3.2% | 3.5% |
| 2026 Actual | 3.1% | 3.4% |
The industry spread was narrow. No industry reported average merit increases above 3.2% . High Tech delivered the highest average total increase at 3.6%, while Chemicals and Other Manufacturing sat at the bottom with 2.9% .
Reality Check
Reality Check: No one texts you money from a compensation survey. Mercer and other providers collect employer-reported pay data to help companies set salaries. The numbers describe what other employers pay, not what you are owed. If a page promises a “compensation survey payout” or asks for a fee to access your salary data, it is not a real survey. Real data comes from participating employers, not from public claim forms.
Who Actually Uses Mercer Compensation Survey Data?
Mercer’s compensation survey data is used primarily by HR teams, compensation analysts, and finance leaders at employers that participate in the survey or buy access to the results . The data helps them set salary ranges, adjust pay structures, and benchmark specific jobs against the market.
The survey covers a wide range of roles and industries. Mercer’s main US database represents 21 million employees and over 100 industries . That breadth is why large employers use it. A single company cannot collect reliable market data on its own, so it buys into a pooled dataset.
Individual employees rarely see the raw data. Some employers share summary ranges with managers or employees during salary discussions, but the full dataset is a paid product. If you are negotiating a salary, you are more likely to encounter survey data indirectly, through a recruiter’s range or an HR department’s benchmark.
Why Is Compensation Survey Data Always Out of Date?
Compensation survey data is always out of date because the collection, aggregation, and publication cycle takes months. By the time a survey reaches your desk, the market it describes has already shifted . That is not a flaw in Mercer’s process. It is the nature of survey data.
Payscale described the problem plainly in October 2026: a benchmark does not look stale. It has the same decimal points and percentiles as fresh data. That is what makes it risky . You cannot feel the gap between what the market pays today and what the survey measured six months ago.
The practical implication is that survey data is a starting point, not a final answer. It tells you where the market has been. It does not tell you what a candidate will accept this week or what your competitor just offered.
Key Takeaway: Survey data is structurally backward-looking, and the 6 to 12 month lag means you should treat every benchmark as a historical reference, not a live price.
How Do You Read Compensation Survey Percentiles?
You read compensation survey percentiles by understanding what each one means: the 50th percentile is the market median, the 75th is above market, and the 25th is below. The percentile tells you where a pay rate falls relative to other employers in the survey, not whether the rate is fair or affordable.
A common mistake is paying everyone at the median without considering company strategy . The median is a reference point, not a mandate. A company that wants to lead the market might target the 75th percentile. A company managing costs might target the 25th or 40th.
| Percentile | What It Means |
|---|---|
| 25th | Below market; lower-cost strategy |
| 50th | Market median; standard benchmark |
| 75th | Above market; lead strategy |
| 90th | Premium; rare roles or top talent |
Survey data also shows averages, but averages can be distorted by outliers. Percentiles give a clearer picture of the distribution .
How Do You Choose a Reliable Compensation Survey?
You choose a reliable compensation survey by checking sample size, update frequency, job matching method, and whether the data is verified. A large sample for your specific industry and location matters more than a big headline number from a national average .
Mercer’s survey is one option, but it is not the only one. Salary.com, Payscale, Pearl Meyer, and Western Management Group all publish compensation data . The right choice depends on your industry, the roles you are pricing, and whether you need national or geographic-specific data.
Red flags include surveys with tiny samples for your roles, data that has not been updated in more than a year, and providers that will not explain their job matching methodology. A survey that matches jobs by title alone, rather than responsibilities, will produce misleading numbers .
What Happens Next in Compensation Survey Cycles?
The survey cycle is predictable, and the next major data points are already scheduled.
October 19 to 30, 2026: Mercer’s October Compensation Planning Survey window opened, with results expected in late November .
Expected late November 2026: October survey results published, showing 2027 budget projections.
Expected early 2027: New survey participation windows open for the next cycle.
Ongoing: Employers adjust salary structures annually or biennially, with just under 60% planning adjustments in 2026 averaging 2.6% .
No public action: No claim deadline or administrator exists because this is a data product, not a settlement.
Frequently Asked Questions
What is compensation survey data?
It is employer-reported pay information collected by survey providers and used to benchmark salaries against the market.
Is Mercer compensation survey data free?
No. Employers typically participate in exchange for results or pay for access. Individual employees usually do not see the raw data.
How accurate is Mercer’s 2026 salary data?
The data is accurate for what it measures: employer-reported pay from 756 organizations. It is not a live market feed and carries a 6 to 12 month lag.
What was the average merit increase in 2026?
Mercer reported a mean merit increase of 3.1% and a total increase of 3.4% for 2026 .
Why is survey data always outdated?
Collection, aggregation, and publication take months, so the data describes a market from 6 to 12 months before publication .
Can I use compensation survey data to negotiate my salary?
Yes, as a reference point. Survey percentiles help you understand where a range falls, but they are not a guarantee of what an employer will pay.
What is the difference between merit and total increase?
Merit increase is base pay raise for performance. Total increase includes merit plus promotions, adjustments, and other raises.
Where can I find reliable compensation survey data?
Mercer, Salary.com, Payscale, Pearl Meyer, and Western Management Group all publish survey data. Check sample size and methodology before relying on any source.
The Bottom Line
Compensation survey data is a real tool for setting and benchmarking pay, and Mercer’s 2026 numbers show a tightening market with merit increases at 3.1%. But the data is a historical reference, not a live price. Use it to understand the range, not to dictate the number. The next major data point arrives in late November 2026, when the October survey results publish .