Workers’ Comp Settlement Chart 2026
Quick Answer
- A workers’ comp settlement chart shows state-set weekly benefit caps and formulas, not one fixed nationwide payout table.
- Amounts depend on your state, average weekly wage, and impairment rating, and range roughly from $360 to $1,716 per week depending on the state and benefit type.
- There’s no single deadline. Each state sets its own statute of limitations and rate effective dates, several of which change July 1 or October 1, 2026.
If you’re searching “workers’ comp settlement chart,” here’s the direct answer: there’s no single, universal dollar chart that applies to every state. Each state sets its own maximum weekly benefit, minimum benefit, and body part schedule, and those numbers change every year.
This matters because a chart pulled from an old blog post or a different state can badly mislead you about what your claim is actually worth. Florida’s 2026 maximum weekly rate is $1,358. Connecticut’s is $1,716 for the same benefit type, effective the same year.
This article breaks down verified 2026 rates for Florida, Maryland, Oklahoma, Colorado, Virginia, and Connecticut, plus how permanent partial disability charts and back injury claims actually get calculated. One detail worth knowing upfront: several states update their maximum rate mid-year, not every January 1, which is why the “2026 rate” question doesn’t always have one clean answer.
The Facts
| Case | State-by-state workers’ compensation benefit rate reference, not a single lawsuit or settlement |
| Status | Verified against 2026 rate notices from Florida, Maryland, Oklahoma, Colorado, Virginia, and Connecticut agencies |
| Fund Size | Not applicable, benefit rates are set annually by each state, not paid from a lawsuit settlement fund |
| Est. Per Person | Varies by state, average weekly wage, and injury type; see state tables below |
| Claim Deadline | Not applicable here, each state sets its own statute of limitations for individual claims |
| Administrator | Not applicable, each state’s workers’ compensation commission or board administers claims directly |
| Proof Needed | Medical documentation of the injury and a treating physician’s permanent impairment rating |
Is the Workers’ Comp Settlement Chart Accurate?
A workers’ comp settlement chart is only accurate if it’s current for your specific state and your specific date of injury, since rates change every year and sometimes twice a year. A chart labeled “2026” from a national blog can still be wrong if it doesn’t specify which state or which effective date range it covers.
Several states update rates on different schedules. Florida adjusts every January 1. Colorado and Oklahoma adjust every July 1. Connecticut adjusts every October 1. Virginia’s 2026 rate changes on July 1, 2026, replacing the rate that applied from July 2025 onward.
Key phrase to remember: the correct rate for your claim is the one in effect on your date of injury, not the rate in effect when you search for it.
Are Online Workers’ Comp Settlement Calculators Legit?
Some are legitimate estimation tools built on official state formulas, but none can tell you your exact settlement amount, since actual settlements involve negotiation, medical evidence, and case-specific facts a calculator can’t see. Several states, including Florida, publish their own official benefit calculators.
Third-party calculators can be useful for a rough estimate if they clearly cite the correct state statute and current rate. Be cautious of any calculator or “chart” that asks for payment before showing you a number, or that promises a guaranteed settlement figure.
Reality Check applies directly here: no legitimate calculator, chart, or website can guarantee what your claim will settle for, because real settlements depend on your medical records, your impairment rating, and negotiation with the insurer or a workers’ comp judge.
What Is a Workers’ Comp Settlement Chart?
A workers’ comp settlement chart is a table showing how much an injured worker can receive per week, or in total, based on their state’s disability type, wage, and impairment rating formulas. It’s a reference tool, not a promise of a specific payout.
Most state charts cover four benefit categories:
| Benefit Type | What It Covers |
|---|---|
| Temporary Total Disability (TTD) | Weekly wage replacement while you can’t work at all, during recovery |
| Temporary Partial Disability (TPD) | Partial wage replacement if you can work in a limited capacity |
| Permanent Partial Disability (PPD) | A scheduled or whole-person award for lasting impairment after maximum medical improvement |
| Permanent Total Disability (PTD) | Ongoing benefits if you can never return to any work |
Key Takeaway: a settlement chart tells you the formula and the cap, not your final number, since your final number depends on your wage, injury, and state.
Workers’ Comp Settlement Chart by State: How Rates Compare
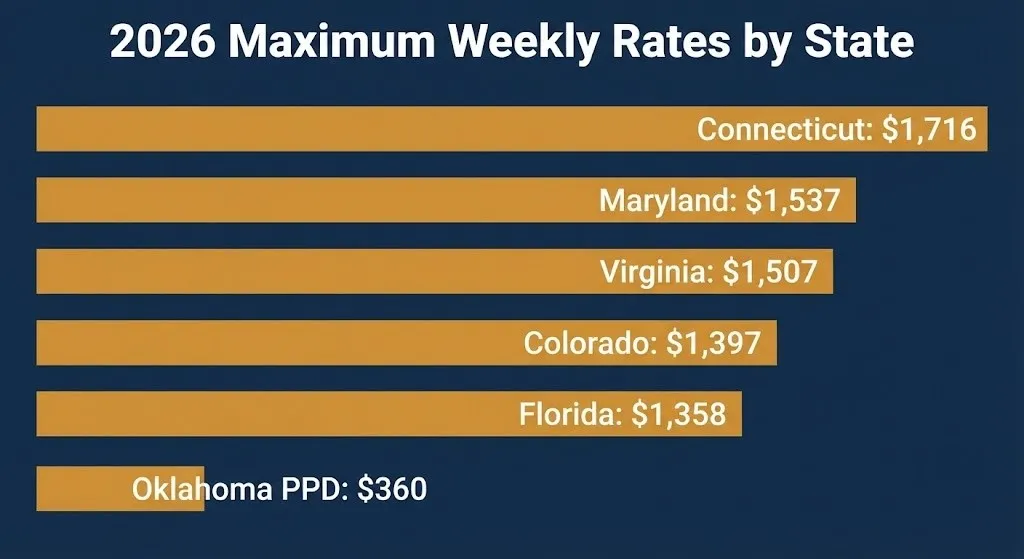
State workers’ comp maximum weekly rates for 2026 vary by more than $1,350 per week between the lowest and highest states covered here. That gap alone shows why a “national” settlement chart can’t work.
| State | 2026 Maximum Weekly TTD Rate | Effective Period |
|---|---|---|
| Florida | $1,358 | Injuries on or after January 1, 2026 |
| Maryland | $1,537 | Calendar year 2026 |
| Oklahoma | $360 (PPD max; TTD 2026 rate not yet finalized as of this writing) | PPD rate stable since July 2021 |
| Colorado | $1,396.85 | July 1, 2025 to June 30, 2026 |
| Virginia | $1,507.01 | Effective July 1, 2026 |
| Connecticut | $1,716.00 | October 1, 2025 to September 30, 2026 |
Not yet confirmed: Oklahoma’s 2026 maximum TTD rate, since the Oklahoma Workers’ Compensation Commission had not finalized that specific figure as of the most recent published guidance.
Florida Workers’ Comp Settlement Chart
Florida’s 2026 maximum weekly workers’ comp benefit is $1,358, based on 100 percent of the statewide average weekly wage under Florida Statute 440.12. This applies to injuries occurring on or after January 1, 2026.
Florida pays Temporary Total Disability (TTD) at two-thirds of your average weekly wage, capped at $1,358. TTD and Temporary Partial Disability (TPD) combined can’t exceed 104 weeks under Florida Statute 440.15.
| Florida 2026 Benefit | Rate |
|---|---|
| Maximum weekly rate | $1,358 |
| Minimum weekly rate | $20 |
| TTD formula | 66.67% of average weekly wage |
| TTD/TPD combined duration cap | 104 weeks |
| Impairment Income Benefits (IIB) rate | 75% of TTD rate |
Florida’s Impairment Income Benefit schedule pays a tiered number of weeks per point of impairment: 2 weeks per point for a 1 to 10 percent rating, 3 weeks per point for 11 to 15 percent, 4 weeks per point for 16 to 20 percent, and 6 weeks per point for ratings of 21 percent or higher.
Maryland Workers’ Comp Settlement Chart
Maryland’s 2026 maximum weekly Temporary Total Disability rate is $1,537, matching the state’s average weekly wage for the year under Maryland Labor and Employment Code Section 9-620. Permanent Partial Disability awards under 75 weeks are capped separately.
| Maryland 2026 Benefit | Rate |
|---|---|
| Maximum weekly TTD rate | $1,537 |
| Minimum weekly TTD rate | $50 |
| Maximum PPD rate | $513 per week |
| TTD formula | 66.67% of average weekly wage |
Example from Maryland’s own published guidance: a worker with 30 percent lost use of an arm plus 15 percent whole body impairment for a neck injury would receive a combined award over 165 weeks. At the 2026 maximum PPD rate of $513 per week, that totals $84,645, though actual awards depend entirely on the individual’s wage and rating.
Oklahoma Workers’ Compensation Rates and Settlement Chart
Oklahoma’s Permanent Partial Disability rate is capped at $360 per week, a figure that has remained unchanged since injuries occurring after July 1, 2021, under 85A O.S. Section 45(C). PPD benefits pay 70 percent of pre-injury wages, up to that $360 cap, multiplied by a number of weeks tied to the impairment rating and body part affected.
| Oklahoma Benefit | Rate |
|---|---|
| Maximum weekly PPD rate | $360 (stable since July 2021) |
| PPD formula | 70% of average weekly wage, capped at $360 |
| 2025 maximum TTD rate | $1,083.46 |
| 2026 maximum TTD rate | Not yet finalized as of this writing |
Not yet confirmed: Oklahoma’s exact 2026 TTD maximum. The Oklahoma Workers’ Compensation Commission sets this annually based on the state’s average weekly wage, and the specific 2026 figure had not been published in official rate tables as of the most recent guidance available.
Colorado Workers’ Comp Settlement Chart
Colorado’s maximum Temporary Total Disability rate for injuries between July 1, 2025, and June 30, 2026 is $1,396.85 per week, requiring pre-injury weekly wages of at least $2,095.27 to hit that cap. Colorado also places a combined lifetime cap on temporary and permanent disability benefits together.
| Colorado 2025-2026 Benefit | Rate |
|---|---|
| Maximum weekly TTD rate | $1,396.85 |
| Scheduled loss (PPD) weekly rate | $438.33 |
| Combined cap, whole person impairment 19% or less | $192,996.79 |
| Combined cap, whole person impairment 20% or more | $312,967.77 |
Key Takeaway: Colorado’s cap structure means a worker with a whole person impairment rating over 20 percent has access to substantially more combined benefits, over $312,000, than one rated at 19 percent or below.
Virginia Workers’ Comp Settlement Chart
Virginia’s maximum weekly compensation rate rises to $1,507.01 effective July 1, 2026, up from $1,463.10 for the prior year, according to the Virginia Workers’ Compensation Commission. The minimum rate rises to $376.75 on the same date.
| Virginia Benefit | July 2025 to June 2026 | Effective July 1, 2026 |
|---|---|---|
| Maximum weekly rate | $1,463.10 | $1,507.01 |
| Minimum weekly rate | $365.78 | $376.75 |
| Cost-of-living adjustment | 2.85% (Oct. 1, 2025) | 2.65% (Oct. 1, 2026) |
Virginia pays TTD and TPD at two-thirds of average weekly wage, using earnings from the 52 weeks before the injury under Virginia Code Section 65.2-101.
Connecticut Workers’ Comp Settlement Chart
Connecticut’s maximum weekly compensation rate for total disability is $1,716.00, effective for injuries occurring October 1, 2025, through September 30, 2026, based on a state average weekly wage of $1,715.03. This is the highest total disability cap among the six states covered in this article.
| Connecticut 2025-2026 Benefit | Rate |
|---|---|
| Maximum weekly TTD rate | $1,716.00 |
| Maximum weekly PPD/TPD rate | $1,220.00 |
| Minimum weekly PPD rate | $50.00 |
| TTD formula | 75% of after-tax (spendable) average weekly wage |
Connecticut calculates TTD differently than most states on this list. Instead of a flat two-thirds of gross wages, it uses 75 percent of after-tax spendable earnings, which is why the state publishes detailed weekly benefit conversion tables rather than a simple percentage formula.
Permanent Partial Disability Rating Body Parts Chart
A permanent partial disability body parts chart, sometimes called a schedule of losses, assigns a specific number of compensable weeks to each body part based on your impairment rating, and that schedule varies by state rather than following one national standard. There’s no single universal chart, despite how often that phrase gets searched.
Most states organize scheduled injuries around a similar structure:
| Common Chart Elements | How It Works |
|---|---|
| Body part | Arm, leg, hand, foot, eye, hearing, and similar scheduled parts |
| Total weeks assigned | Set by statute for a 100% loss of that body part |
| Impairment percentage | Set by a treating or independent medical examiner |
| Weeks owed | Total scheduled weeks multiplied by your impairment percentage |
| Weekly rate | Your state’s PPD rate, up to that state’s cap |
Back, neck, and whole-body injuries are typically treated differently than scheduled limb injuries. Most states classify these as “unscheduled” or whole-person impairment injuries, calculated as a percentage of total body function rather than against a fixed body-part week count.
Key Takeaway: if you’re searching for a body parts chart, the number of weeks assigned to your specific injury depends entirely on your state’s statute, not a chart that applies everywhere.
Workers’ Comp Settlement for Back Injury Claims
Back injuries are generally treated as whole-person impairment claims rather than scheduled injuries, meaning your settlement is based on a percentage of total body function instead of a fixed weeks-per-body-part chart. This makes back injury settlements harder to estimate from a simple chart alone.
Colorado’s own guidance illustrates this directly: since back injuries fall under “whole person” impairment rather than scheduled limbs, a 10 percent impairment rating for a surgically repaired back would be calculated using the state’s age-factor tables and the current capped rate, not a simple weeks-per-body-part lookup.
Factors that typically affect a back injury settlement include:
- Your impairment rating, assigned after maximum medical improvement.
- Whether surgery was required.
- Your pre-injury average weekly wage.
- Whether you can return to your prior job or need vocational retraining.
- Your state’s whole-person impairment formula and rate cap.
- Future medical care needs tied to the injury.
Not yet determined: any specific dollar figure for a back injury settlement, since amounts depend entirely on your individual medical rating, wage, and state formula rather than a fixed chart value.
How Do I Use a Workers’ Comp Settlement Chart to Estimate My Payout?
You use a workers’ comp settlement chart by matching three things correctly: your state, your date of injury, and your specific benefit type, then applying that state’s formula to your own average weekly wage. Skipping any one of those three steps produces a wrong estimate.
Here’s the general process:
- Identify your state and confirm the workers’ compensation agency that governs your claim.
- Find your date of injury, since rates apply based on the injury date, not the current date.
- Locate your state’s official maximum and minimum weekly rate for that date.
- Calculate your average weekly wage using your state’s specific formula (commonly 13, 52, or another defined period).
- Apply your state’s percentage formula (commonly two-thirds, 70 percent, or 75 percent of after-tax wages).
- Compare that number against your state’s cap; use the lower of the two.
- For permanent injuries, obtain your impairment rating from an authorized physician before estimating further.
- Cross-check your math against your state’s official calculator, if one is published.
What Changed in Workers’ Comp Settlement Rates for 2026?
Every state covered in this article adjusted its maximum weekly rate for the 2026 cycle, though the size of the increase and the effective date varied significantly. Connecticut posted the largest confirmed year-over-year jump among the six states, rising from $1,654 to $1,716 for total disability.
| State | Prior Rate | 2026 Rate | Change |
|---|---|---|---|
| Florida | Set annually each January 1 | $1,358 | Confirmed for 2026 |
| Maryland | $1,456 (2024) | $1,537 | Increase confirmed |
| Colorado | Prior year lower | $1,396.85 | Increase confirmed |
| Virginia | $1,463.10 | $1,507.01 | Increase effective July 1, 2026 |
| Connecticut | $1,654.00 | $1,716.00 | Increase confirmed |
Key Takeaway: nearly every state raised its 2026 maximum rate, which means a chart showing 2025 or earlier numbers will understate what a maximum-wage worker could receive this year.
How Are Workers’ Comp Settlements Calculated?
Workers’ comp settlements are calculated by combining your average weekly wage, your state’s benefit percentage formula, your impairment rating if the injury is permanent, and your state’s statutory cap. No two claims use identical math, even within the same state.
This works a bit like calculating a tax refund. The formula is public and consistent, but the actual number depends entirely on your specific inputs, in this case your wage history, injury severity, and medical documentation, not a flat number anyone can quote you in advance.
Settlements typically fall into two categories. A structured settlement continues periodic payments similar to ongoing benefits. A lump sum settlement resolves the claim with a single negotiated payment, often used to close out future medical and wage-loss exposure at once.
Why Do Workers’ Comp Settlement Amounts Vary So Much by State?
Workers’ comp settlement amounts vary by state because each state legislature sets its own wage-replacement percentage, its own maximum and minimum caps, and its own schedule for permanent injuries, with no federal standard governing the dollar amounts. Workers’ compensation in the United States is regulated at the state level, not nationally.
That’s why Connecticut’s 2026 total disability cap of $1,716 per week is roughly 4.7 times higher than Oklahoma’s permanent partial disability cap of $360 per week, even though both are legitimate, currently enforced state maximums. Comparing a chart from one state directly to another without adjusting for these structural differences will always produce a misleading picture.
What Happens Next
July 1, 2026 (confirmed): Virginia’s new maximum weekly rate of $1,507.01 and minimum of $376.75 take effect.
October 1, 2026 (confirmed): Virginia’s cost-of-living adjustment of 2.65 percent applies to eligible long-term claims.
Expected, mid-2026: Oklahoma is expected to finalize its 2026 maximum TTD rate based on updated state average weekly wage data.
Expected, January 2027: Florida is expected to publish its next annual maximum compensation rate update, effective January 1, 2027.
Expected, October 2026: Connecticut is expected to publish its next average weekly wage determination for the October 2026 to September 2027 benefit period.
Frequently Asked Questions
What is the highest workers’ comp settlement chart rate among these states?
Connecticut currently has the highest confirmed maximum weekly rate at $1,716.00 for total disability, effective through September 30, 2026.
That’s the highest total disability cap among the six states covered in this article.
What is the lowest workers’ comp settlement chart rate among these states?
Oklahoma’s permanent partial disability rate is capped at $360 per week, the lowest confirmed figure among the states covered here.
That rate has remained unchanged since injuries occurring after July 1, 2021.
Is there one national workers’ comp settlement chart?
No, there’s no single national chart, since workers’ compensation is regulated separately by each state.
Every state sets its own wage-replacement percentage, caps, and permanent injury schedule.
How much does a back injury settle for in workers’ comp?
There’s no fixed amount, since back injuries are typically rated as whole-person impairment and calculated using your specific wage and impairment percentage.
Colorado’s own guidance confirms back injuries use age-factor and whole-person formulas rather than a fixed body-part chart.
Do workers’ comp rates change every year?
Yes, most states adjust their maximum and minimum weekly rates annually, though the effective date differs by state.
Florida updates every January 1, Colorado and Oklahoma update every July 1, and Connecticut updates every October 1.
What determines my permanent partial disability payout?
Your payout depends on your impairment rating, your average weekly wage, your state’s PPD rate cap, and whether your injury is scheduled or whole-person.
No universal body parts chart applies across every state.
Can I use a settlement calculator instead of a chart?
Yes, official state calculators, like Florida’s, can give a rough estimate based on your specific wage and rating.
These tools still can’t guarantee your final settlement amount, which depends on negotiation and medical evidence.
Before relying on any workers’ comp settlement chart, confirm it matches your specific state and your date of injury, since even a single year’s difference can change your maximum rate by more than $50 a week. As of July 22, 2026, six major state maximums range from $360 to $1,716 per week, a gap wide enough to make a generic chart unreliable for your specific claim.